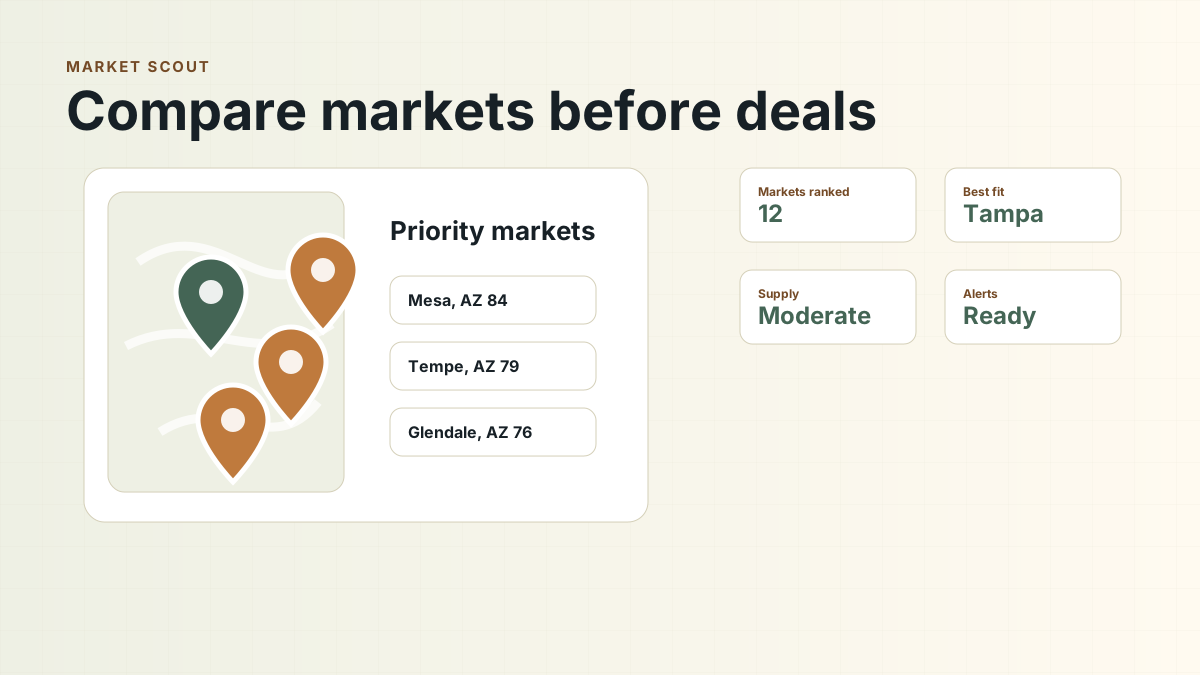
A market comparison should explain why a specific customer base can support a business after operating costs and acquisition debt. A cheap listing can still create a profitability problem if demand is weak or customers cannot conveniently reach the site. The SBA market research guide provides a starting framework for testing demand and competition.
Local market analysis does not need to be perfect. It needs to help you avoid obviously poor-fit markets before you spend weeks with brokers, lenders, and sellers.
A strong market must still be paired with verified business earnings, a supportable price and an operator who can execute. Use the market memo to explain financing assumptions, not to replace the financial statements.
Why market comparison comes before listings
Listings are seller-selected. Markets are buyer-selected. If you choose the market first, you can decide where your capital, operating skills, and financing options are most likely to fit.
Before pursuing listings, estimate borrowing capacity from buyer injection, remaining liquidity, credit and operating experience. Work backward from prospective debt service to the cash flow you need. This gives the market search an affordable size range.
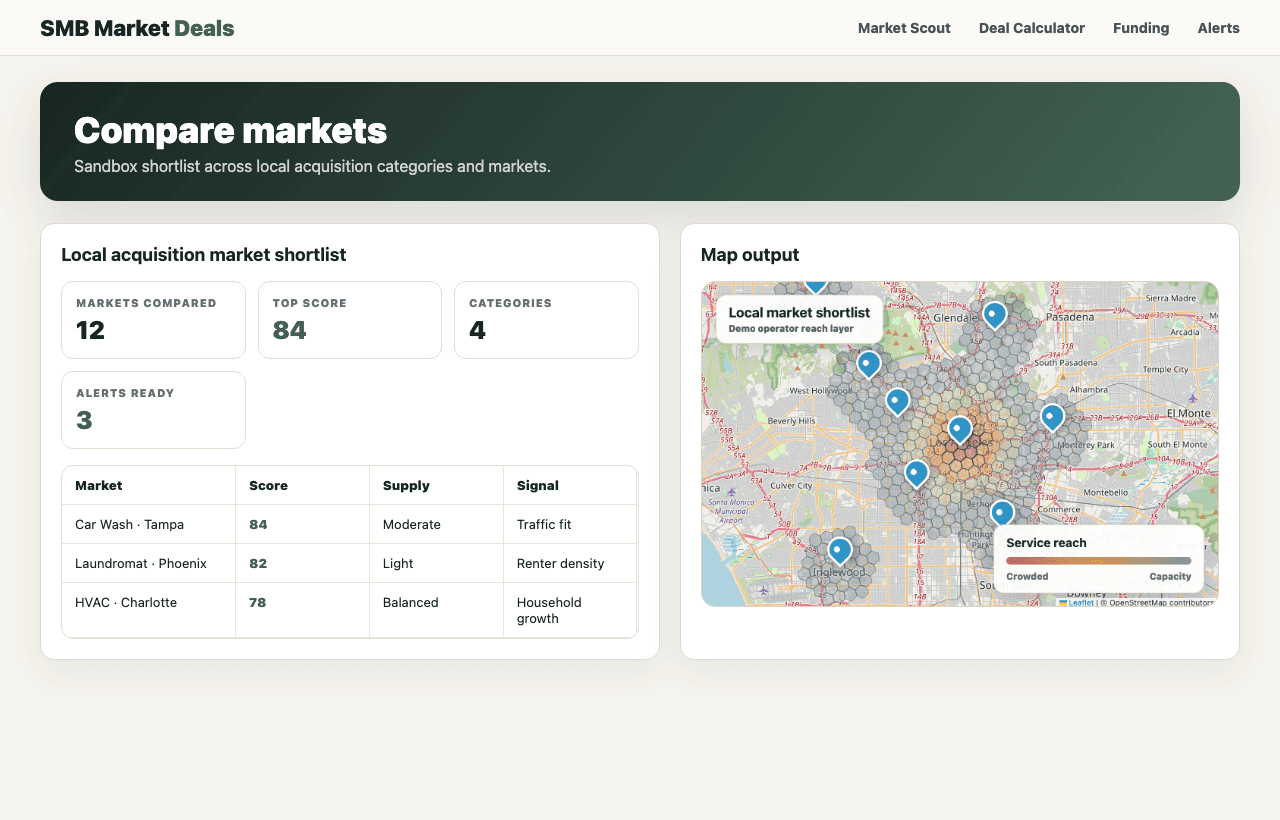
Compare demand base
Every category has a different demand base. Laundromats often start with renter households and access. HVAC depends more on households, housing stock, service radius, and technician capacity. Car washes are more traffic-sensitive. Child care depends on households with young children and local commuting patterns. ACS data is useful because it lets buyers match the denominator to the business model instead of relying on total population alone.
Connect demographic evidence to the target's own customer addresses and sales. Record which customer group actually pays the company, where it lives or works, and whether the observed pattern supports the sales forecast.
Match business category to demand base
Use the right denominator before calling a market under-served.
| Business type | Useful demand base | What to verify locally |
|---|---|---|
| Laundromat | Renter households and apartment density. | In-unit laundry, parking, visibility, safety, competitor quality. |
| HVAC | Households, housing age, and service radius. | Technician supply, recurring agreements, local competition. |
| Car wash | Population, traffic corridors, vehicle ownership context. | Ingress/egress, nearby washes, environmental/site constraints. |
| Child care | Children under 5 and commuting patterns. | Licensing, staffing, local tuition, waitlists. |
A reproducible Arizona market comparison
We calculated renter share from the Census ACS 2018–2022 five-year B25003 estimates already loaded in SMB Market Deals. These four Arizona ZCTAs illustrate how the choice of denominator changes a laundromat shortlist. They are statistical areas, not exact postal delivery areas or customer drive-time catchments.
Renter households in four Arizona ZCTAs
| ZCTA | Occupied households | Renter households | Renter share |
|---|---|---|---|
| 85008 | 23,098 | 16,447 | 71.2% |
| 85016 | 18,559 | 9,315 | 50.2% |
| 85201 | 20,978 | 13,382 | 63.8% |
| 85281 | 27,715 | 21,734 | 78.4% |
ZCTA 85281 has 21,734 renter households versus 9,315 in 85016: about 2.33 times as many. Renter share is 78.4% versus 50.2%, a 28.2 percentage-point gap using unrounded inputs. This establishes a demand-screen difference, not a conclusion that 85281 is underserved. Check in-unit laundry, campus housing, competitor capacity, prices and access.
A supply comparison needs the same geography and unit. Ten stores divided by 20,000 renter households is 0.5 stores per 1,000 renter households; six divided by 8,000 is 0.75. Those are hypothetical competitor counts. Do not mix county establishment totals with ZCTA households or treat a missing provider result as zero competition.
Turn the market memo into lending evidence
| Category | Evidence to add |
|---|---|
| Laundromat | Lease assignment, machine schedule, utilities, near-term capex and environmental questions |
| HVAC | License continuity, technician retention, agreement renewals and fleet condition |
| Car wash | Zoning, water/discharge permits, property control and measured access |
| Child care | Licensing, staff ratios, enrollment, fees and documented waitlists |
Keep an evidence log with geography, data vintage, formula, local observations and contrary evidence. Refresh the Census estimates before an offer. For child care, obtain actual ACS age estimates: the current database's under-five field is a population-based proxy and should not be presented as a measured local age count.
Compare supply and saturation
A market with ten competitors is not automatically worse than a market with three. The question is how many operators exist relative to demand and whether they are high quality, low quality, old, new, specialized, or poorly located.
Weak competitors and projected growth do not justify an unsupported purchase price. Underwrite the target's documented earnings and transferable relationships before assigning value to improvements.
Census County Business Patterns can support establishment-level context by industry, but it does not replace ground truth. Pair public establishment data with Google Places, local directories, site visits, and customer reviews.
Ask whether reachable demand can support sufficient cash flow after operating expenses, appropriate replacement compensation, debt service and transition costs. A competitor count alone cannot answer that question.
Compare trade-area friction
A circular radius can lie. Highways, rivers, rail lines, parking constraints, unsafe crossings, hills, commute paths, and school zones can all change how customers move. For a walk-up business, one block can matter. For a service business, dispatch coverage and drive time matter more.
Measure both sales access and operating cost. Customer-location exports, dated traffic counts, timed dispatch trips and site observations provide evidence. Record the geography and date for each measure so a lender can reproduce the comparison.
Compare financing and transition fit
Some markets produce more attractive operations but harder financing. A business with heavy equipment, short leases, volatile revenue, or high customer concentration may be harder to finance even in a strong local market. Compare lender readiness alongside market quality.
Transition fit is equally local. A buyer who can operate a suburban home-service company may not be the right operator for a dense urban storefront with parking constraints, union labor, complex licensing, or heavy landlord negotiation. Market quality only matters if the buyer can execute in that market.
Use the same memo format for every market. A consistent format keeps you from writing long optimistic notes for markets you already like and shallow skeptical notes for markets that might actually be better.
Before a binding offer, give the lender the proposed price, three years of filed business returns, current interim financials, supported add-backs, a sources-and-uses schedule, seller-note terms, immediate capital needs, buyer resume and proof of injection and remaining liquidity. Ask which valuation, collateral, lease, eligibility and closing conditions could prevent funding.
Local market comparison scorecard
Use this as a buyer memo template.
| Dimension | Strong signal | Weak signal |
|---|---|---|
| Demand | Clear demand base with growing or stable local need. | Demand depends on one employer, one development, or an unsupported story. |
| Supply | Comparable markets suggest room for another operator or better execution. | Crowded market with strong competitors and little differentiation. |
| Trade area | Easy access and customer path match the category. | Physical barriers, parking problems, or poor visibility. |
| Financing | Cash flow, assets, and buyer profile fit lender expectations. | High capex, weak records, thin reserves, or fragile transition. |
| Operator fit | Buyer can understand and improve the business. | Owner role or labor model is outside buyer capability. |
Build a shortlist
End with a shortlist, not a conclusion. Pick the markets worth deeper diligence, the markets to watch with alerts, and the markets to ignore for now. Then call brokers and owners with sharper questions: why this market, why this site, why this customer base, and why this price?
Frequently asked questions
Does a high renter share make a laundromat market attractive?
It can justify more research, but apartment laundry facilities, competitor capacity and access may offset it. Map actual customer travel and verify the seller's customer base.
Can I compare two cities using raw business counts?
Only after normalizing coverage, industry definition, date and demand. A larger city often has more businesses because it also serves more customers.
For acquisition financing requirements and the October 1, 2026 rule change, read our SBA loan guide.